It may have been 9 full months since my last post, but here I am again!
The what
Modern apps are usually following quality KPIs, which are essentially checks against a threshold. These checks often compare a given metric captured from within the application, with the threshold value.
Obviously there is a multitude of ways to measure quality statistics and gather metrics, especially in the Kubernetes world, Prometheus is the de-facto choice - probably deployed with Prometheus Operator or a similar approach. However, a rather new method would be leveraging Grafana’s cloud offering and their collecting agent, which simplifies a lot the whole process. And this is what this article would be about.
On metrics and components
Prometheus is a widely used system - I’d dare say industry standard - for collecting application metrics. Grafana helps visualize these metrics which can help by putting your metrics data into use and build dashboards that make technical (or even business) sense to your stakeholders. Another really important component in this stack is AlertManager, which helps you configure and trigger automatic alerts.
These three components are really important to understand and evaluate the quality and health of your services, no matter the orchestrator you’ve chosen to run your apps onto. However, for the purposes of this post, I’ll focus mostly on Kubernetes-running applications, since I’d like to introduce Grafana Cloud.
Grafana Cloud is a managed cloud offering by Grafana where, among others, we can use a Grafana and Prometheus instance to collect and visualize metrics for our applications. This takes off of our engineering team the burden of deploying, maintaining and securing Grafana and Prometheus instances and let us focus entirely on the metrics of our app.

There are really great blog posts out there describing and setting out examples of how app metrics can and should be collected, the importance of labels on metrics, etc. I’d personally recommend this post to get more familiarized with eg. a Golang app instrumentation.
HOWTO
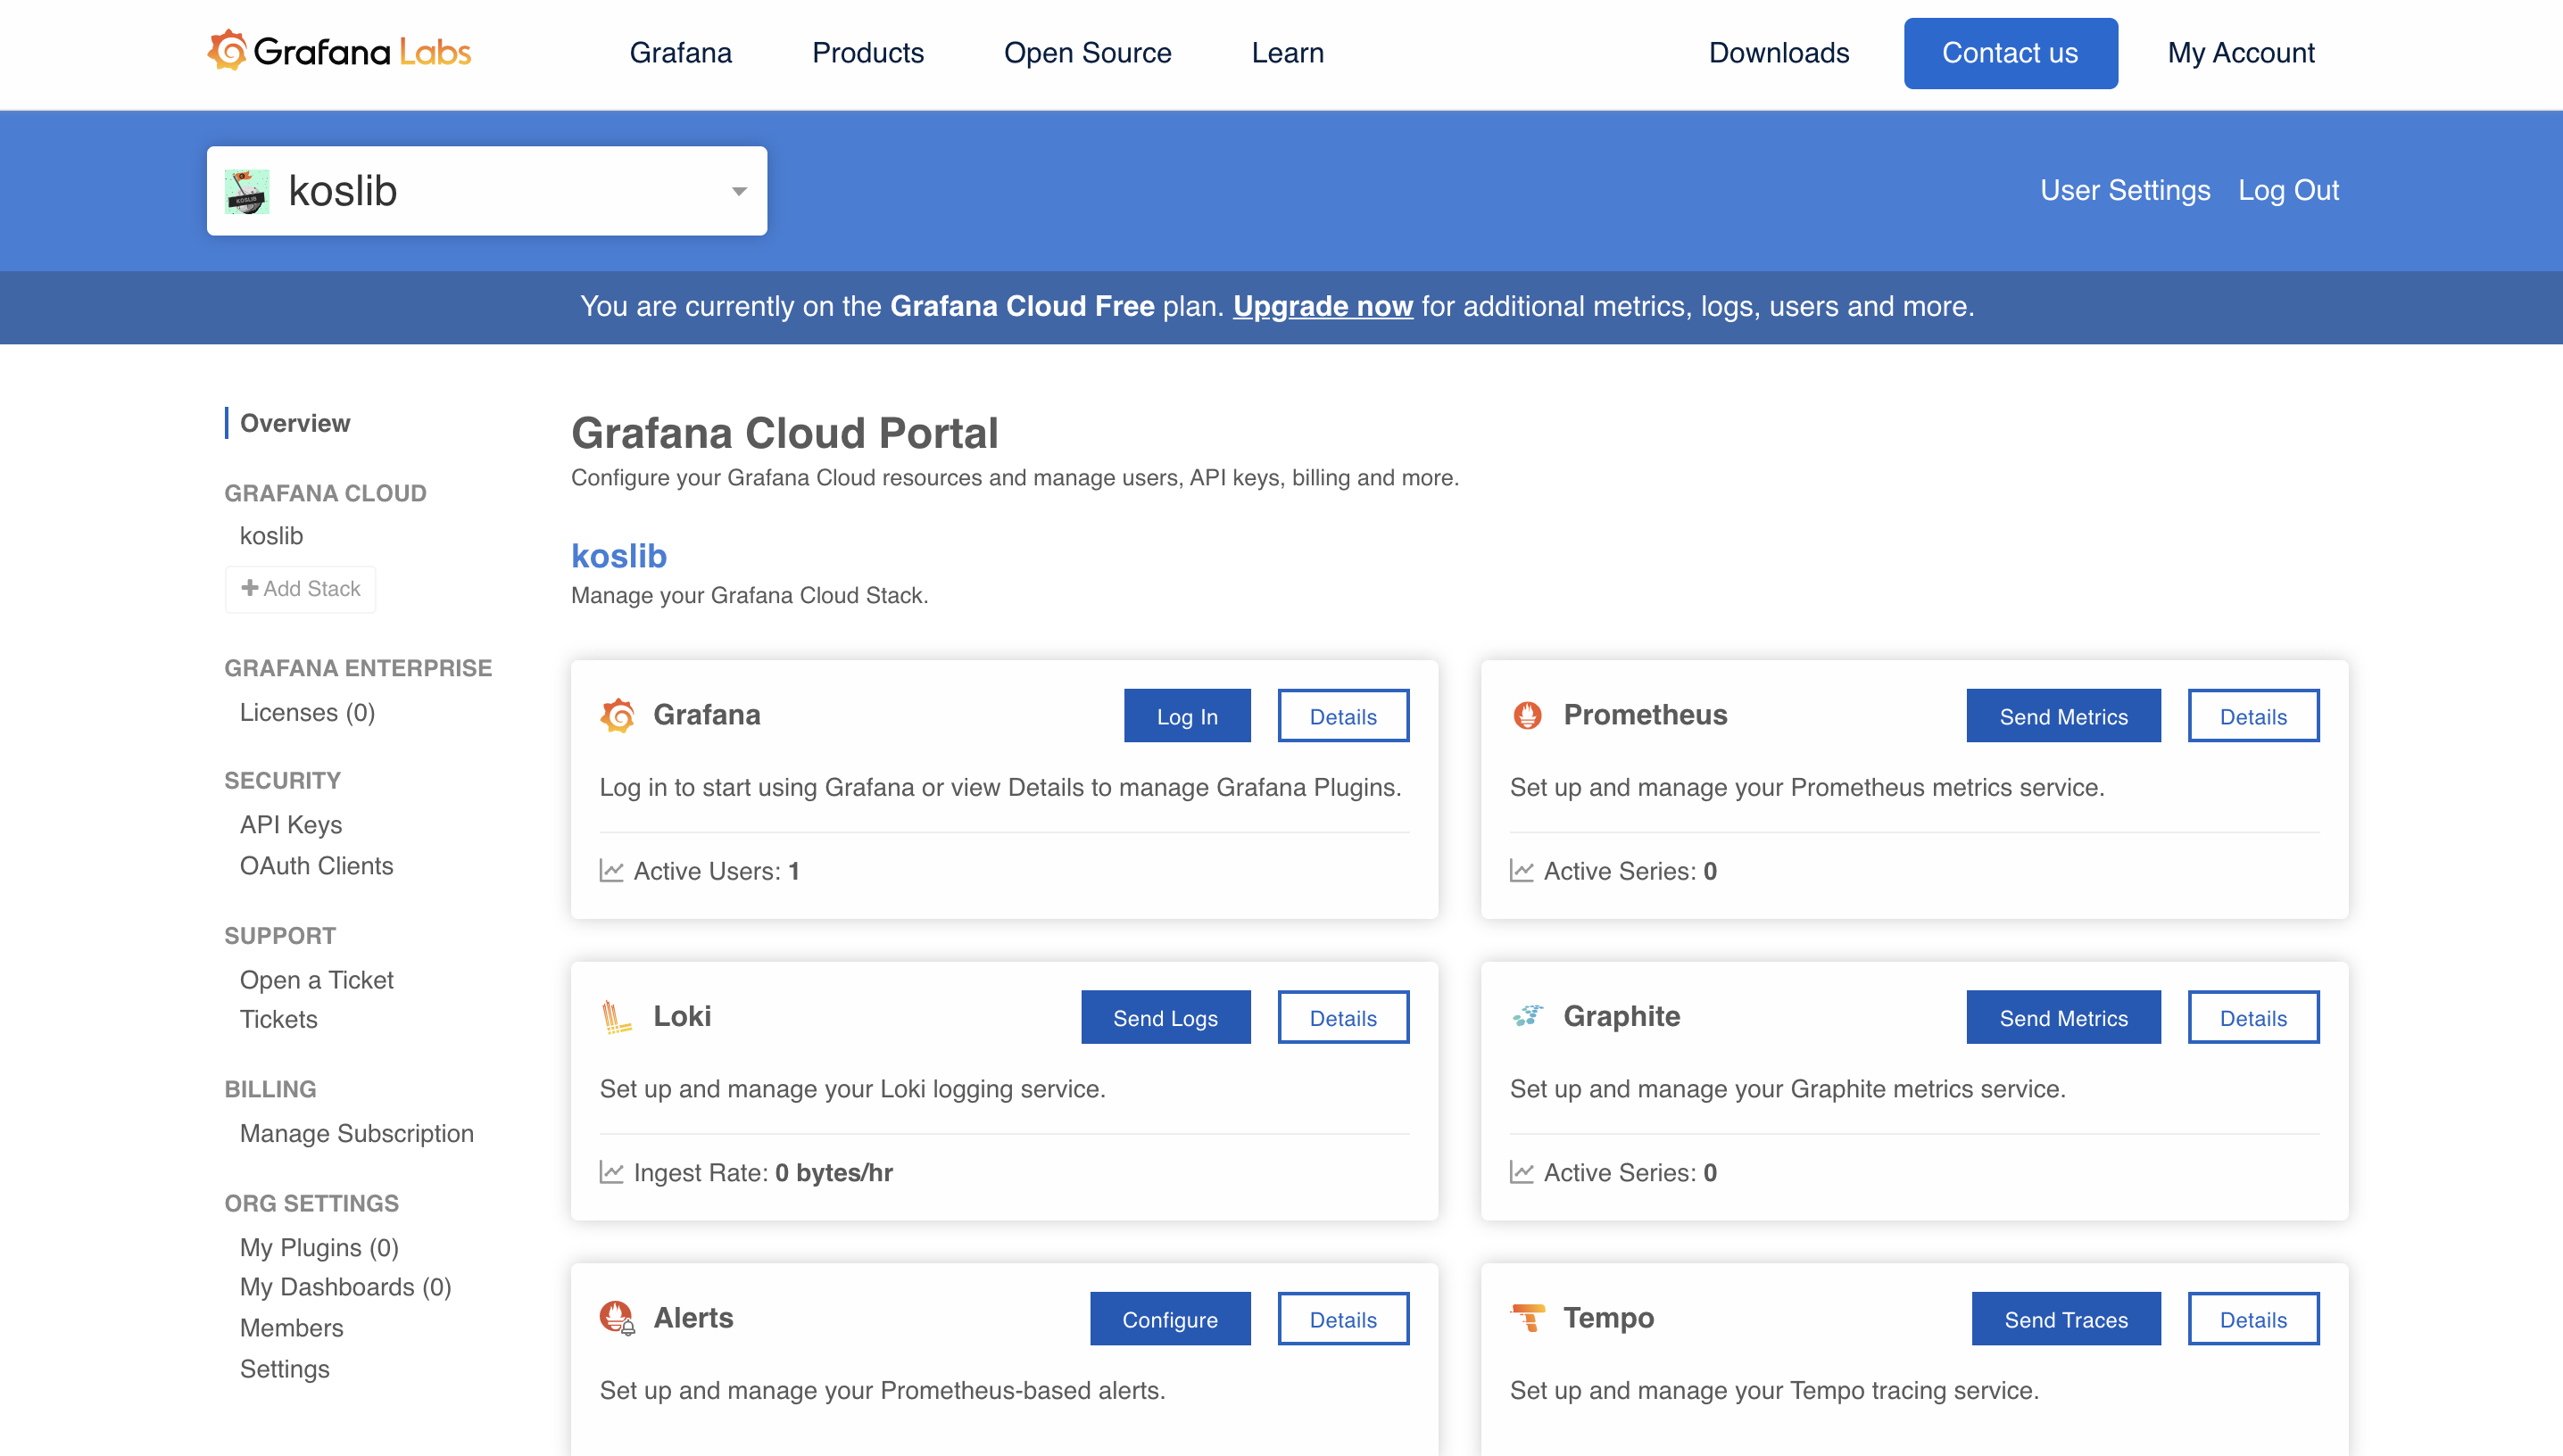
After signing up on Grafana cloud, you should be able to create a “stack”, which is essentially a “project” groupping. You’ll notice that not only Grafana and Prometheus instances are available but all Grafana products (eg. Tempo which is an upcoming star in the tracing ecosystem)! Enable the ones you need.
In a typical use-case, you’d have to deploy a prometheus instance using the Prometheus Operator or a similar technique. However it’s a good chance we optimize for simplicity, therefore we’ll avoid all the hussle and install the Grafana Cloud Agent only.
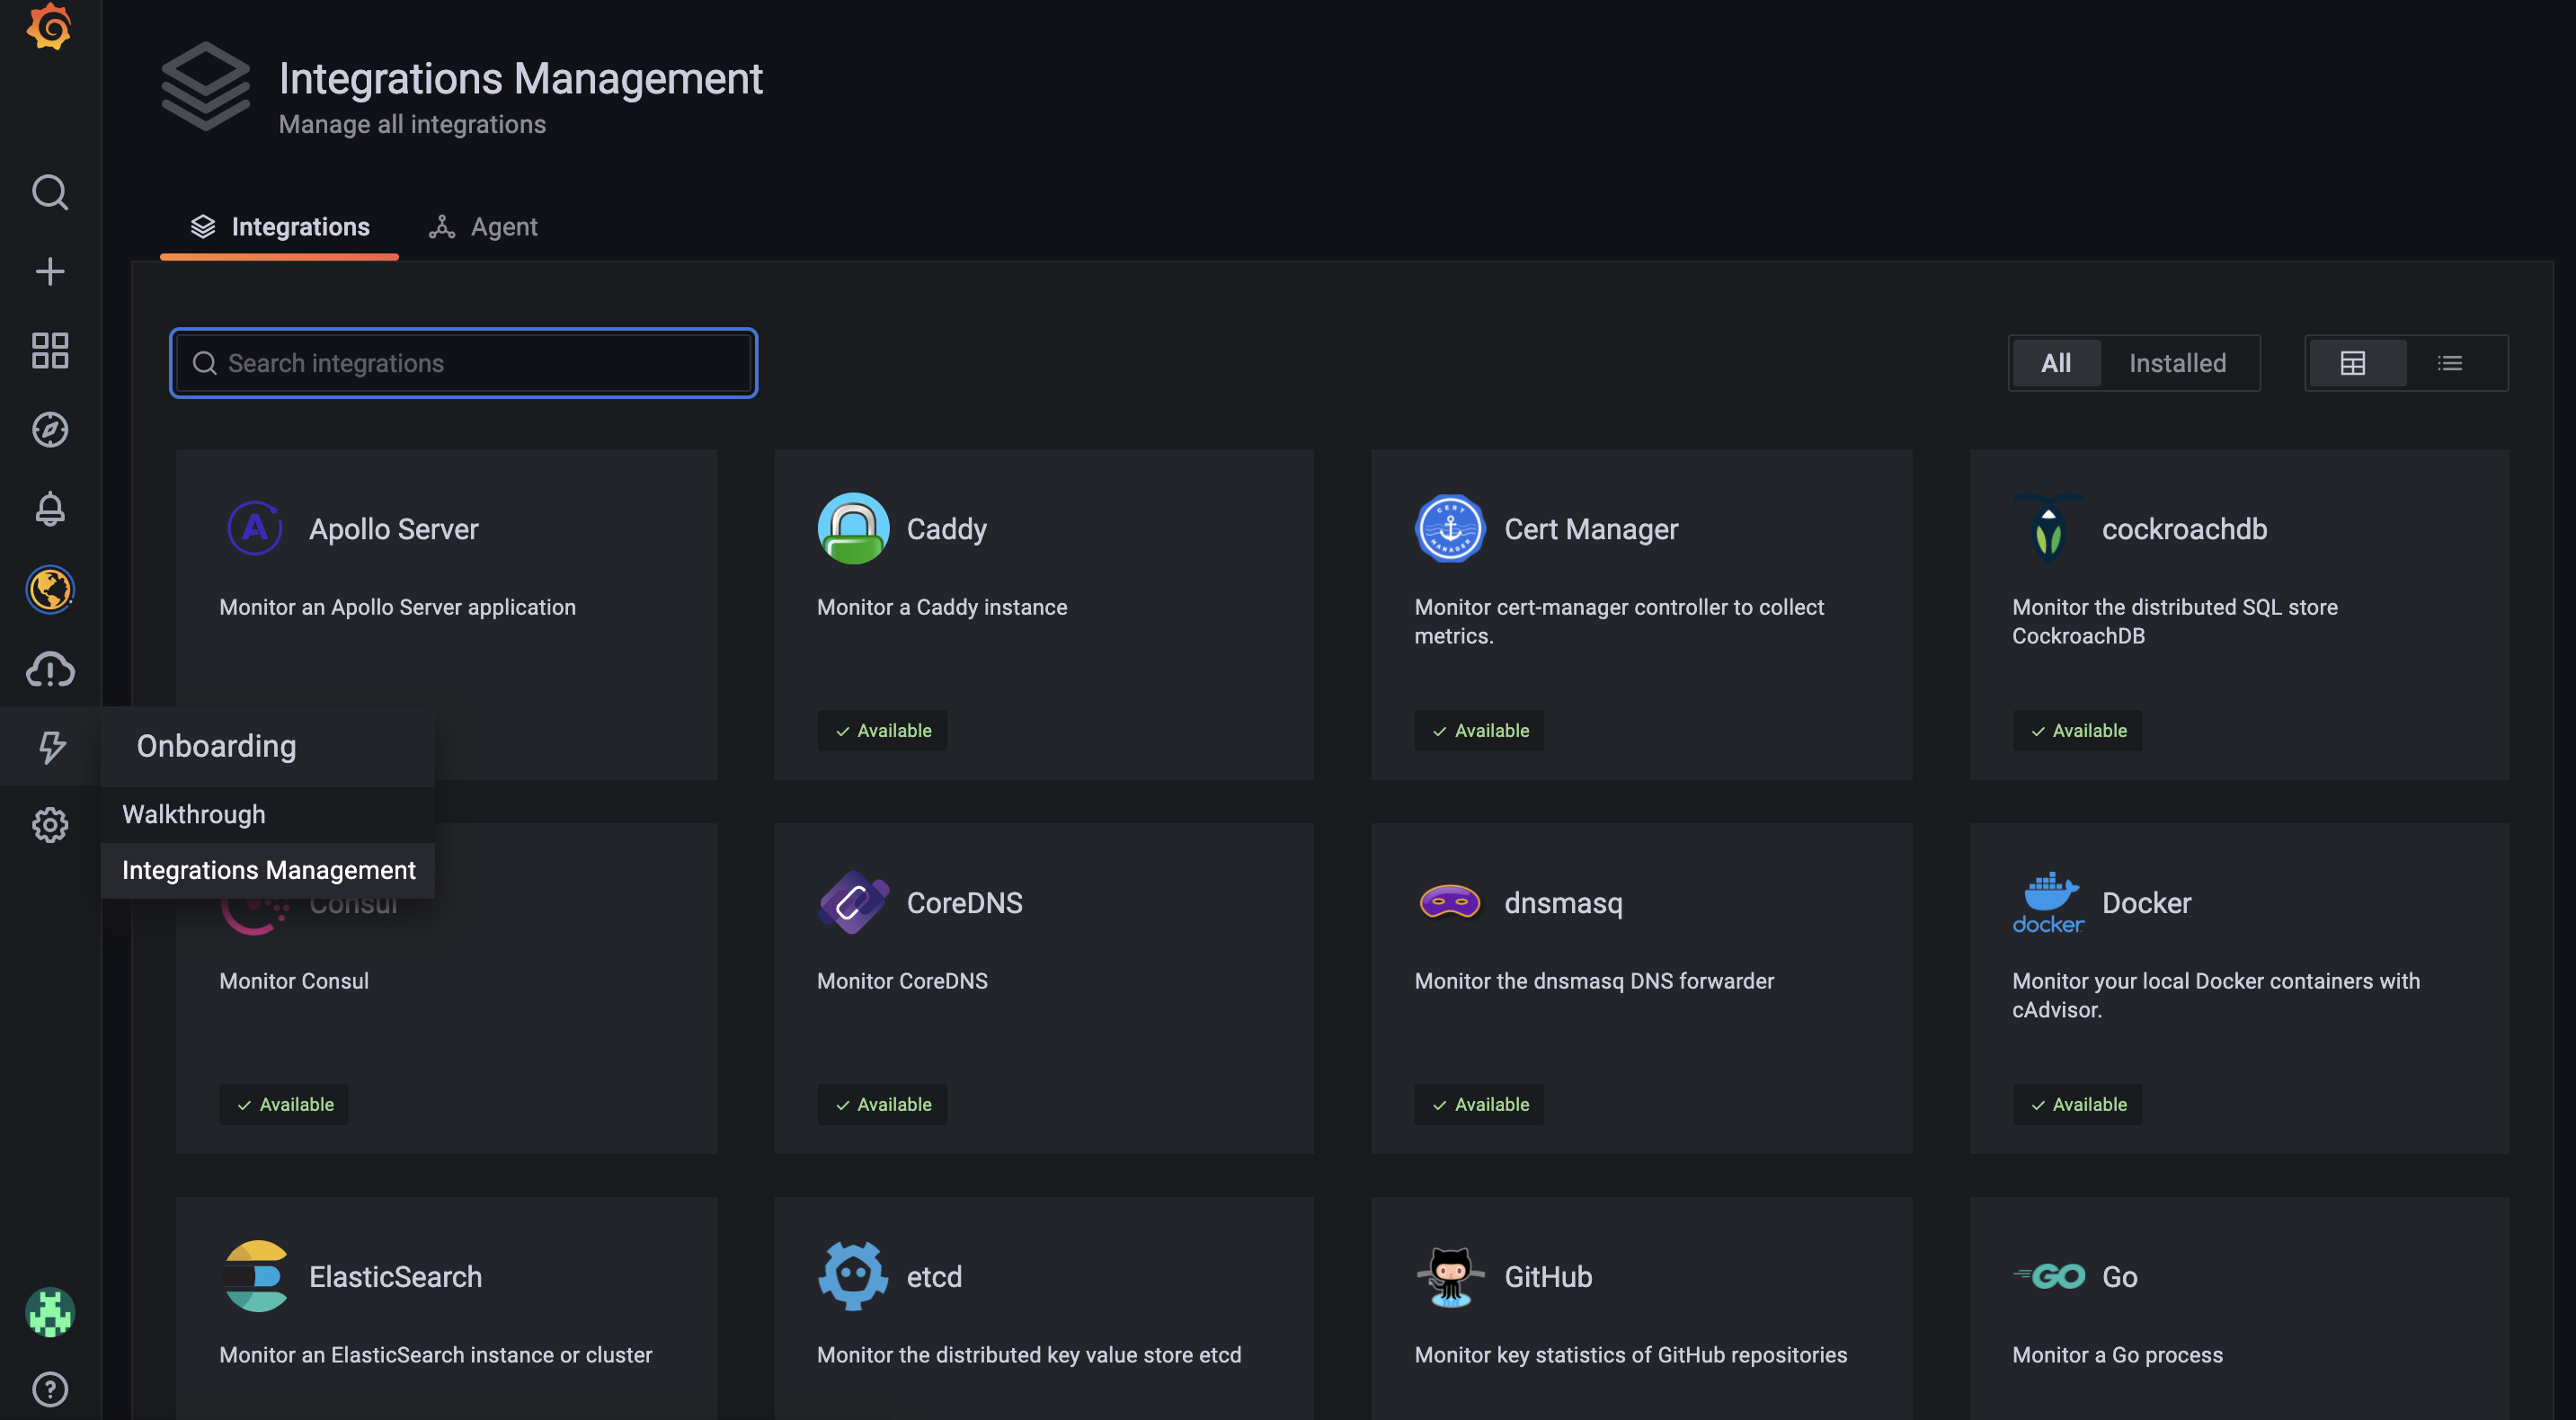
Log into your Grafana instance, and you’ll notice an “Integrations” tab. Go for the “Integrations Management” option.

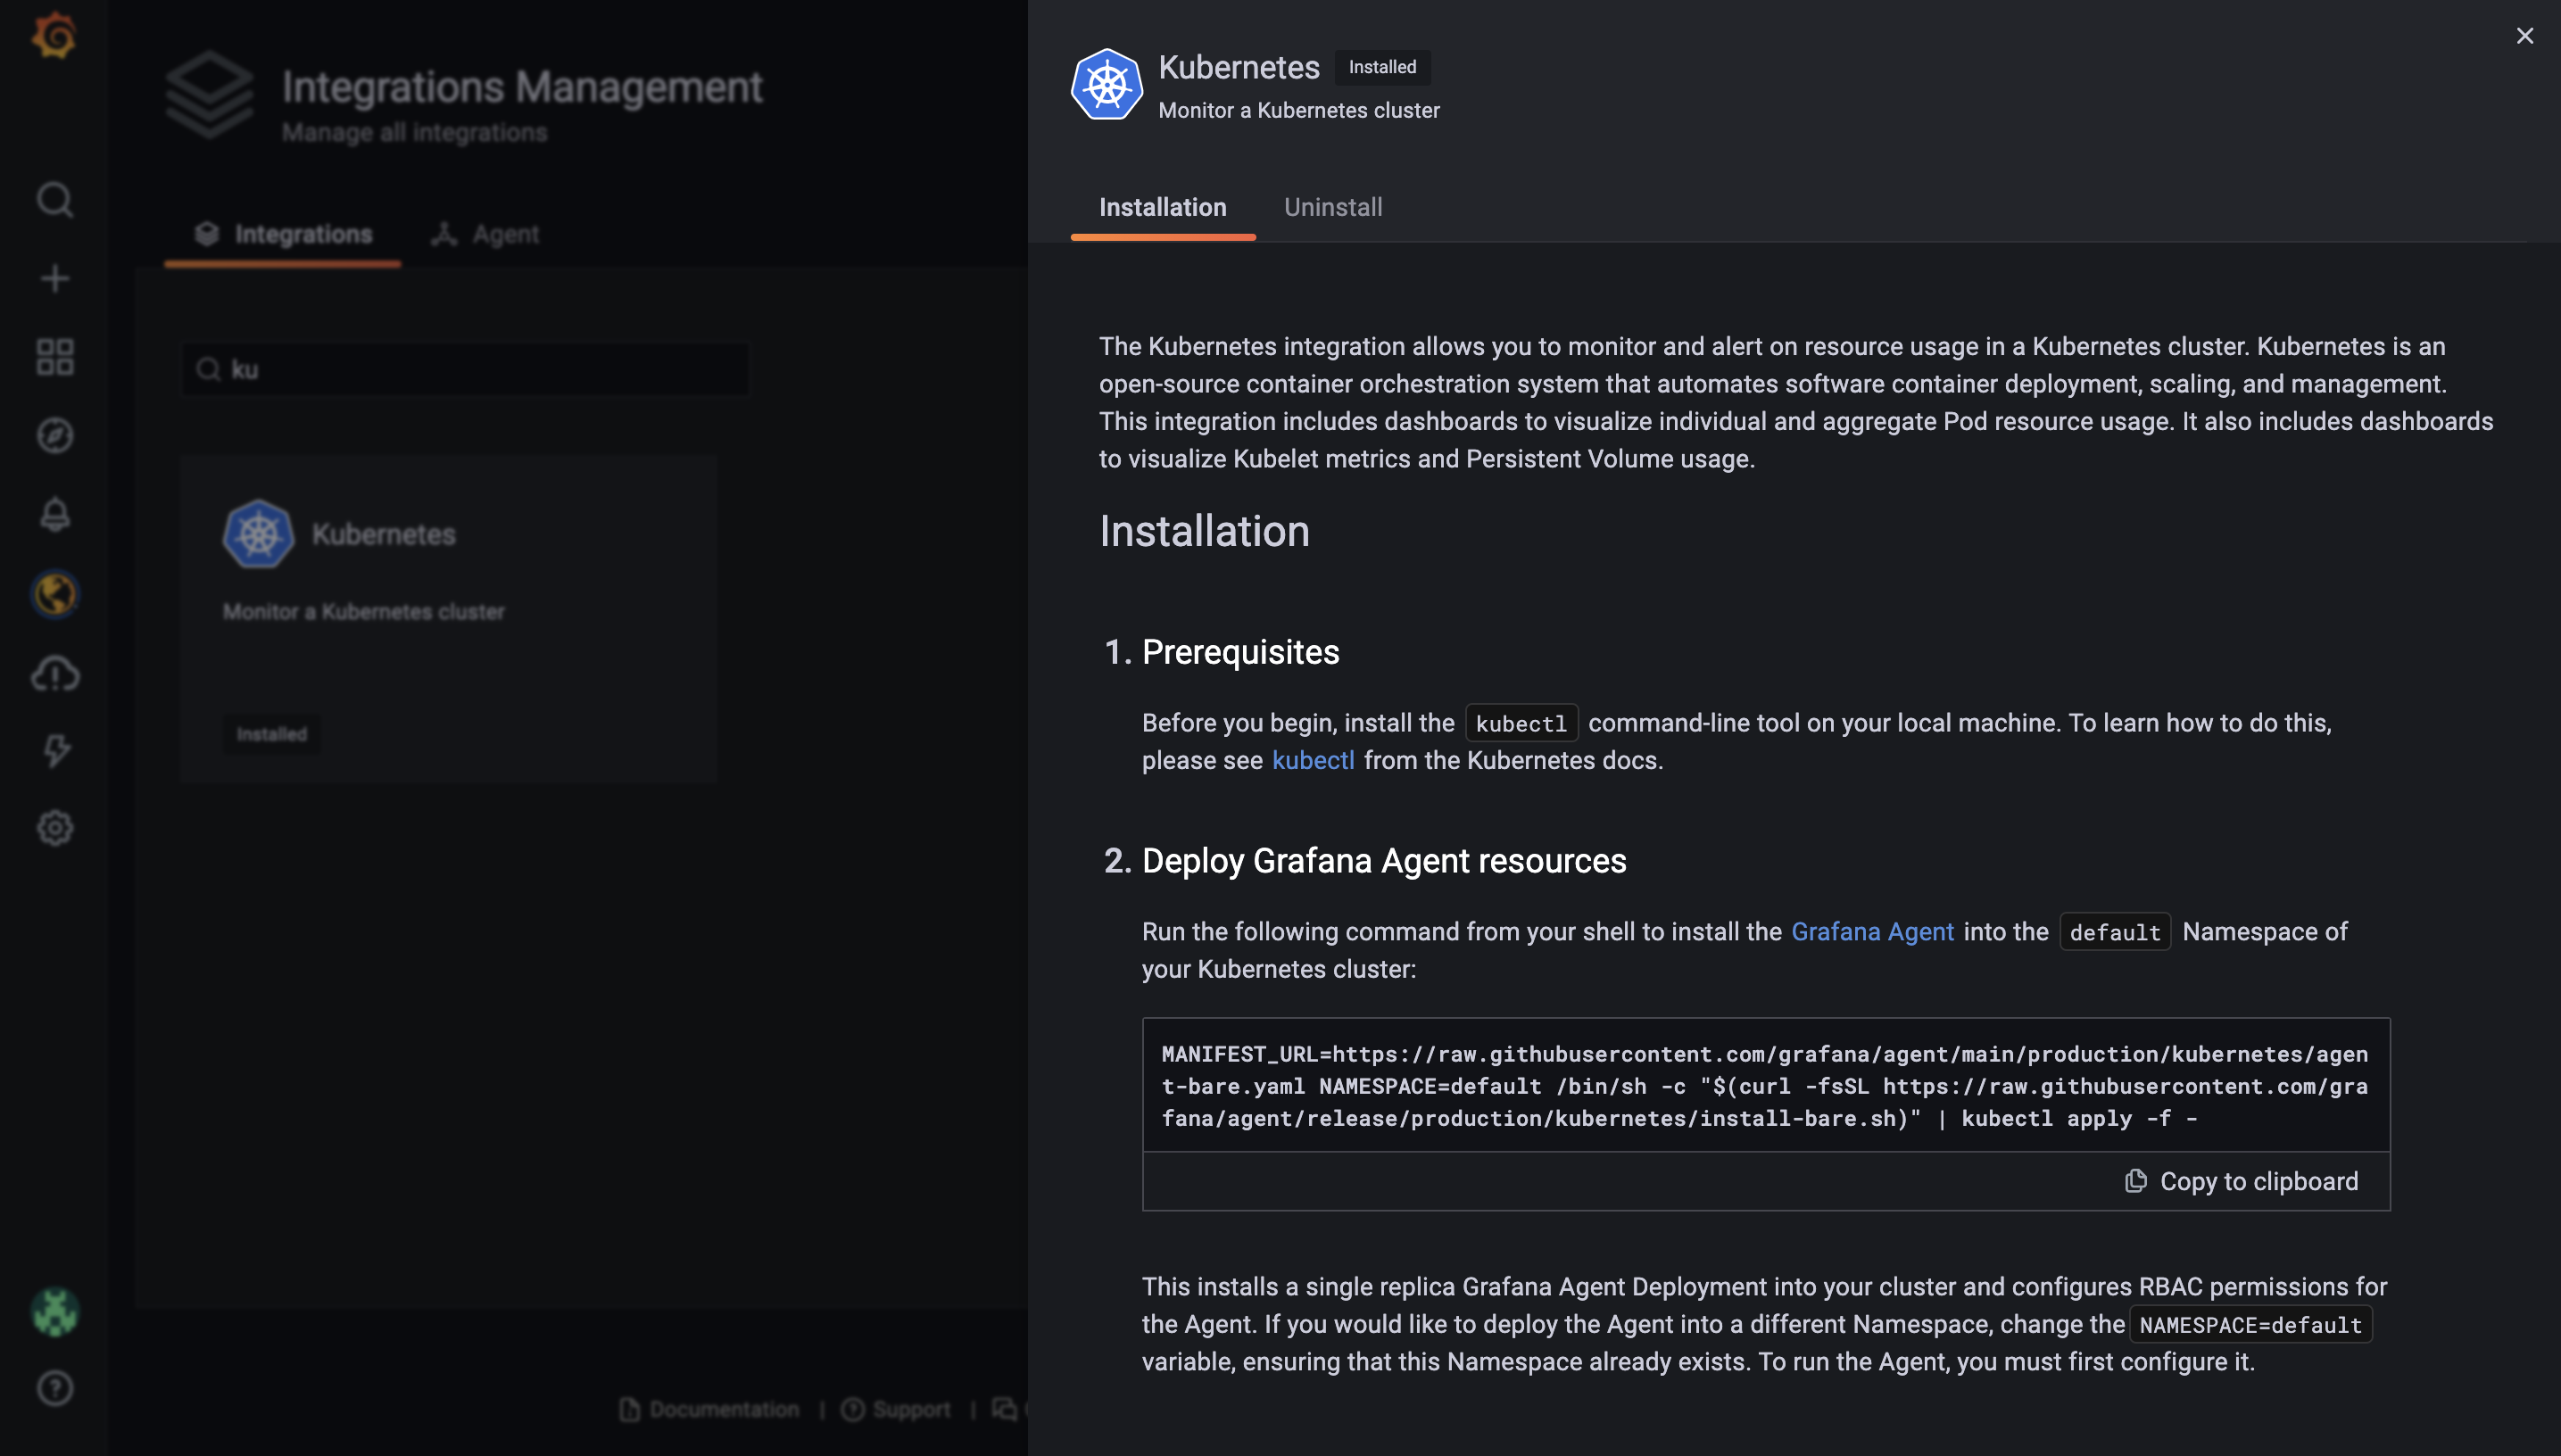
Look for the “kubernetes” integration, which should pop a modal open with all the details you need to set things up. It should look like the following image.

If you follow the instructions on that page, you’ll deploy a grafana agent which is a very lightweight agent collecting (scraping) prometheus metrics from enabled apps.
The agent config is frankly a ConfigMap with the following content:
kind: ConfigMap
metadata:
  name: grafana-agent
apiVersion: v1
data:
  agent.yaml: |
    server:
      http_listen_port: 12345
    prometheus:
      wal_directory: /tmp/grafana-agent-wal
      global:
        scrape_interval: 15s
        external_labels:
          cluster: cloud
      configs:
      - name: integrations
        remote_write:
        - url: https://prometheus-us-central1.grafana.net/api/prom/push
          basic_auth:
            username: <redacted>
            password: <redacted>
        scrape_configs:
        - job_name: integrations/kubernetes/cadvisor
          bearer_token_file: /var/run/secrets/kubernetes.io/serviceaccount/token
          kubernetes_sd_configs:
            - role: node
          metric_relabel_configs:
            - action: drop
              regex: container_([a-z_]+);
              source_labels:
                - __name__
                - image
            - action: drop
              regex: container_(network_tcp_usage_total|network_udp_usage_total|tasks_state|cpu_load_average_10s)
              source_labels:
                - __name__
          relabel_configs:
            - replacement: kubernetes.default.svc.cluster.local:443
              target_label: __address__
            - regex: (.+)
              replacement: /api/v1/nodes/${1}/proxy/metrics/cadvisor
              source_labels:
                - __meta_kubernetes_node_name
              target_label: __metrics_path__
          scheme: https
          tls_config:
              ca_file: /var/run/secrets/kubernetes.io/serviceaccount/ca.crt
              insecure_skip_verify: false
              server_name: kubernetes
        - job_name: integrations/kubernetes/kubelet
          bearer_token_file: /var/run/secrets/kubernetes.io/serviceaccount/token
          kubernetes_sd_configs:
            - role: node
          relabel_configs:
            - replacement: kubernetes.default.svc.cluster.local:443
              target_label: __address__
            - regex: (.+)
              replacement: /api/v1/nodes/${1}/proxy/metrics
              source_labels:
                - __meta_kubernetes_node_name
              target_label: __metrics_path__
          scheme: https
          tls_config:
              ca_file: /var/run/secrets/kubernetes.io/serviceaccount/ca.crt
              insecure_skip_verify: false
              server_name: kubernetes

    integrations:
      prometheus_remote_write:
      - url: https://prometheus-us-central1.grafana.net/api/prom/push
        basic_auth:
          username: <redacted>
          password: <redacted>
Take some time to go through it and not just blindly apply it on your cluster.
Some takeaways I’d recommend paying closer attention to:
- The agent config incorporates configuration for several parts of the integration. Prometheus is just one of them, another could be Loki, in case you had it enabled.
- The
integrationssection takes care of writing the collected prometheus metrics to a remote endpoint. - Prometheus configuration includes a
scrape_configsmap which is the core of metrics scraping configuration. There are some default scrape configs already there, which gather pod usage metrics mostly. No one stops you from extending this map with your config as needed.
As you may have already figured out, only “default” pod metrics are scrapped, not your app specific metric values. You can fix that by adding a scrape target pointing to your service/pod.
Scraping a single target could mean appending a simple scraping config:
- job_name: my_node
  scrape_interval: 15s
  static_configs:
    - targets: [service_name.ns:8080]
But this would successfully scrap and collect metrics for service service_name on namespace named ns only. In a kubernetes environment, this is highly unexpected and not even realistic.
If I had to take a well educated guess, you’d like to scrap all services which have prometheus scraping enabled and expose a /metrics endpoint, in all namespaces. Probably you’d like to explicitly define the namespaces you’re interested in? Still possible. The following config would work as intended:
- job_name: all_services
  kubernetes_sd_configs:
  - role: service

  # Optionally enable specific namespace discovery. If omitted, all namespaces are used.
  namespaces:
    names:
      [ - <string> ]
After updating your agent config and creating the necessary ConfigMap with the correct content as discussed above, remember to update the grafana agent rollout:
kubectl rollout restart deployment/grafana-agent
Allow a few seconds and metrics should already get scraped and written onto your managed Prometheus instance!
What next
Metrics being collected is the first step for enhancing your observability. Visualization comes next. Probably you want to invest some time to build some graphs and gather then in a Grafana dashboard. Based on the metrics type and values (eg. service_errors or http_latency), you can already figure out your thresholds for setting up alarms that fit your case better.
- Getting started with grafana
- Best practises for creating Grafana dashboards
- (Advanced) Extensive guide to configure your AlertManager
Bonus: if you have plenty of alerts configured and it seems difficult to manage all of them via any notification channel, eg. Slack, Karma is a useful groupping/aggregating tool that works aside AlertManager and aims to fill the gap of the missing UI in AlertManager: https://github.com/prymitive/karma.
I’d love to hear your feedback in the comments or help with questions you may have!
Notes
I do not have any affiliation with Grafana neither I’m profiting out of any link posted on this article.